
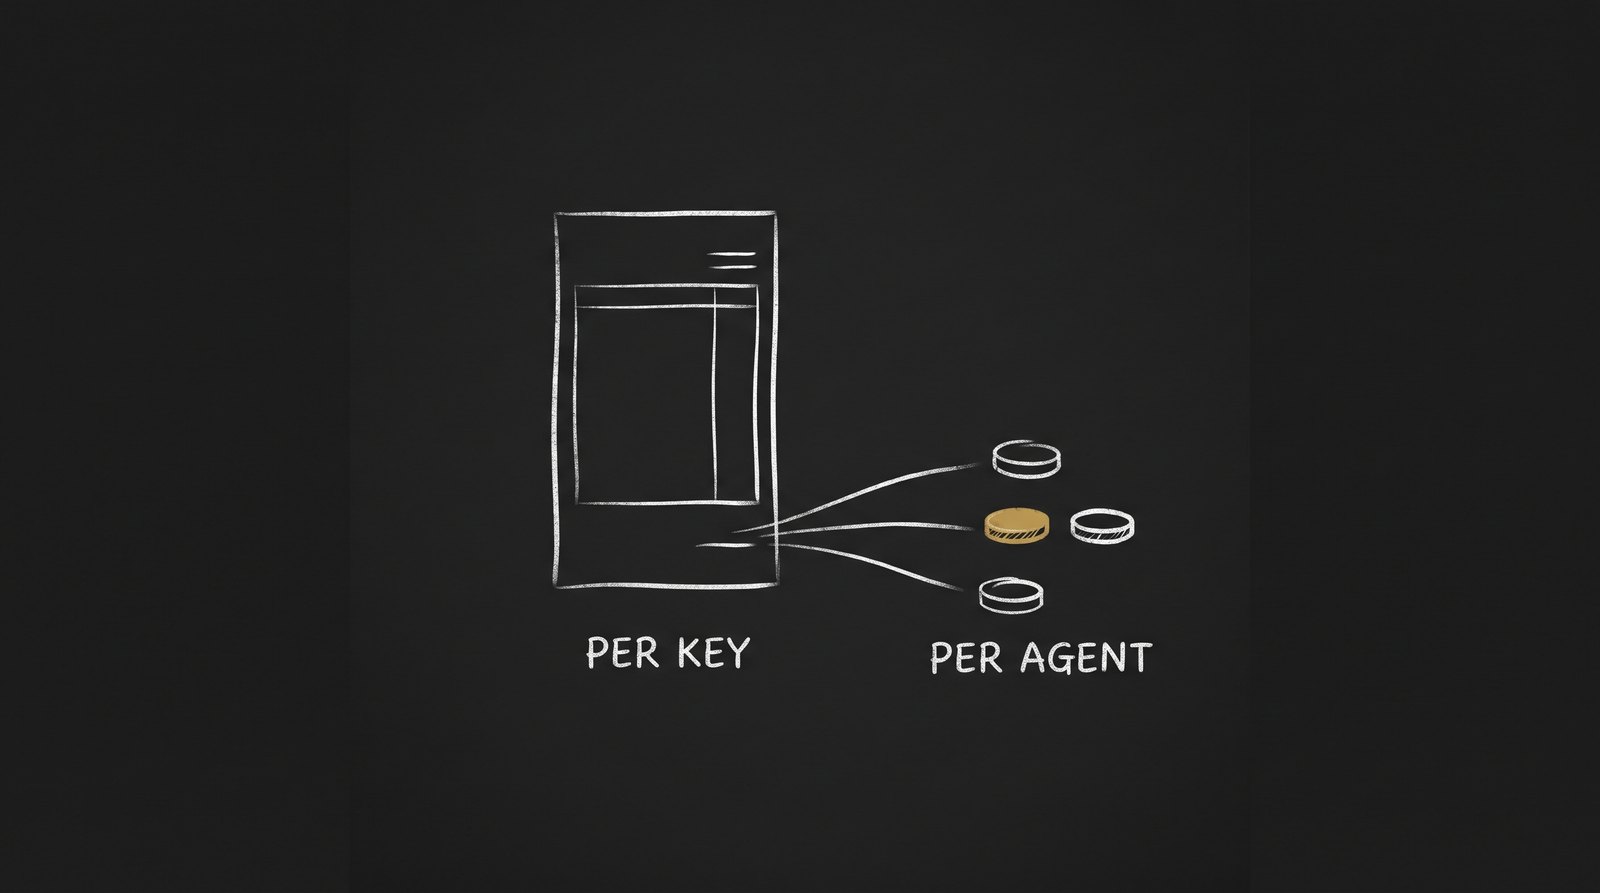
Your LLM provider will tell you, to the cent, what each API key spent last month. That is a genuinely useful number and it is almost never the one you want.
If you run agents on a shared key pool, the bill arrives sorted by key. Your question is sorted by agent. Nothing in the provider console can bridge that, because the provider never knew your agents existed. It saw one key, making requests.
I built the Traces view in SpiderGate to answer the question in the shape people actually ask it.
One request, one trace
Every request through the gateway gets a trace id at the door and carries it to the end. Open the Traces tab and you get one row per request: which agent sent it, which model it asked for, which model actually answered, how long it took, how many tokens, what it cost.
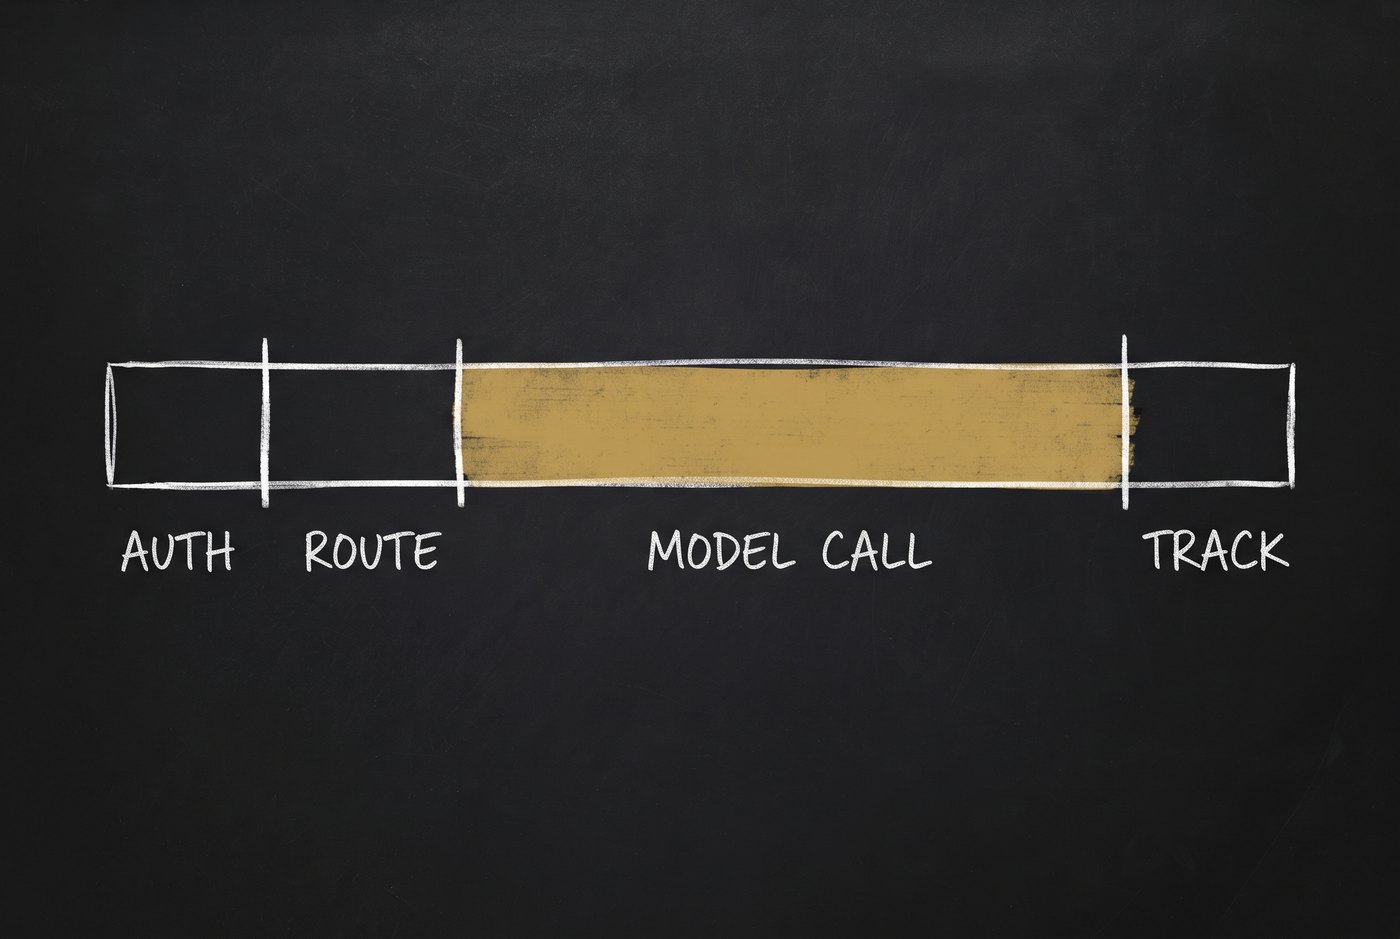
Click a row and the request comes apart into its spans. Auth, routing, the model call, tracking. Each span is a proportional bar, so a slow request shows you where it was slow rather than just that it was. A failed span is red and sits at the point of failure.
That last part matters more than it sounds. When an alias falls through to its second or third model, the trace records the model that actually answered. A gradual drop in output quality usually looks like nothing at all in aggregate metrics, and looks obvious the moment you can see that half your requests stopped being served by the model you chose.

Attribution is a filter, not a report
Filter the list to one agent token and you have that agent's entire history: its requests, its latency, its spend. Or start from the other end, on an agent's card in Keys, and click through to the traces it produced.
On our own OPVS workspace that resolves to six distinct agent tokens, 34,453 requests and $40.76 attributed across thirty days, as of 10 August 2026. The dollar figure is small. The split is the point: before this, that number existed only as one line on one key.
Two stores, and the honest bit about them
Here is the mechanism, because I would rather you know it than discover it.
SpiderGate writes request metadata to its own database on every single call. Model, tokens, cost, latency, status, the trace id. No message bodies, deliberately, because storing every prompt and completion forever is a storage bill and a liability at the same time.
Full message bodies and span timings go to LangFuse, a separate open-source tracing service we run alongside the gateway. Traces there are keyed to your client_id, which is the same identity the API authenticates you with, so a brand only ever sees its own.

Those are two systems, and two systems fail independently. If LangFuse is unreachable, the trace list and the summary stats still load from our own store, without the message bodies. The view degrades instead of going dark. That is a design choice, and it is also the reason the detail page opens on the Overview tab rather than the messages.
If you need a permanent record of prompts and completions, keep it in your own application too. Ours is a tracing backend with a retention window, not an archive.
The number I got wrong first
While building the pool side of this, I read our own key rotation as broken. The pool had twenty-plus OpenRouter keys and only about four looked like they were being used. That is the kind of number you act on.
It was wrong, and it was wrong in an instructive way. I was reading last_used_at on the key record. The routing path that actually serves requests never stamps that column. The keys were rotating perfectly; the field I was measuring them by was simply not being written.
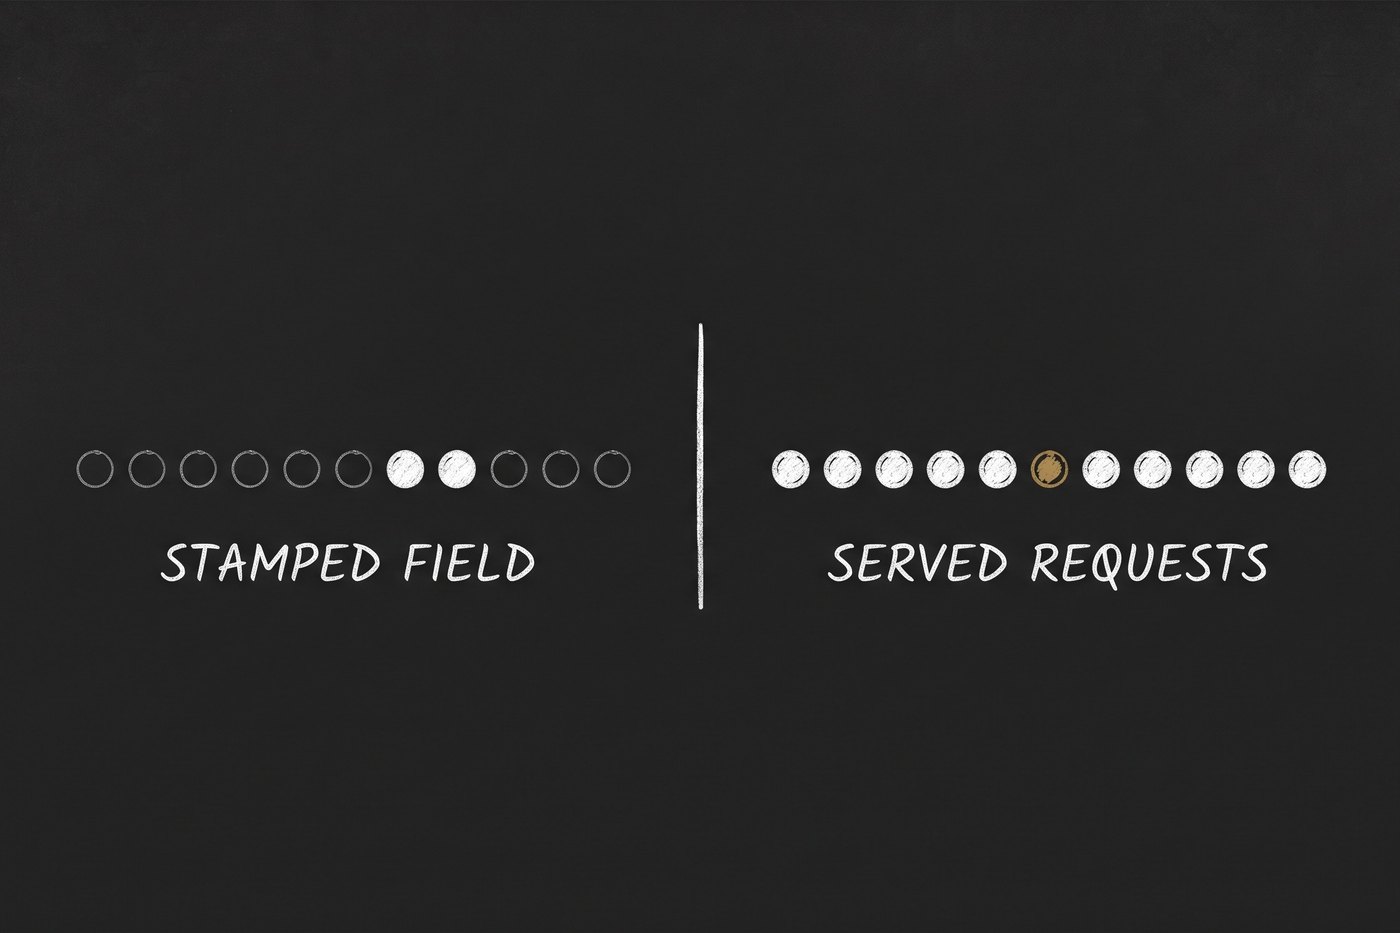
The fix was to stop asking the key what it had done and ask the request log instead: count the distinct keys that appear in served requests over a window. Measured that way, over the twenty-four hours to 10 August 2026, every pool key in the four busiest providers had served traffic. Twenty-two of twenty-two on OpenRouter, thirteen of thirteen on Cerebras, eleven of eleven on Groq, one of one on MiniMax.
I am including a mistake in a launch post on purpose. An observability feature that reports a plausible wrong answer is worse than one that reports nothing, because you will act on it. The only defence is to check what the number is actually counting, and that applies to the numbers on this page too.
Where it is, and where it is not
Traces live in the dashboard, at Gate → Traces, scoped to your brand. The guide is at gate.spideriq.ai/docs/observability/traces.
Being straight about the boundary: today this is a dashboard surface. There is no supported way for an agent to pull its own traces over the API yet, and I would rather say so than let you find out by writing the call. Pool utilisation is an operator view on our side, not something in your dashboard.
Both of those are on the list. Neither is in the product today, so neither is in this post as though it were.